TL; DR
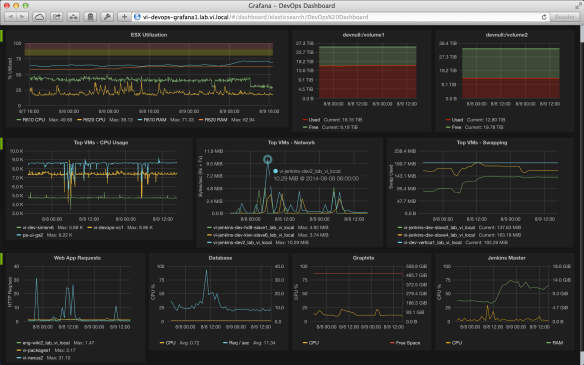
We built a pretty sweet dashboard for our R&D infrastructure using Graphite, Grafana,collectd, and a home-made VMware VIM API data collector script.
Background – Tracking Build Times
The second major project I worked on after joining Virtual Instruments resulted in improving the product build time performance 15x, from 5 hours down to 20 minutes. Having spent a lot of time and effort to accomplish that goal, I wanted to setup tracking of build time metrics going forward by having the build time of each successful build recorded into a system where it could be visualized. Setting up the collection and visualization of this data seemed like a great intern project and to that end for the Summer of 2014 we brought back our awesome intern from the previous Summer, Ryan Henrick.
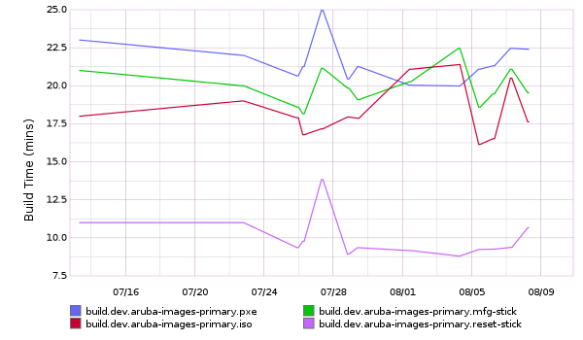
Within a few weeks Ryan was able to setup a Graphite instance and add a “post-build action” for each of our Jenkins jobs (via our DSL’d job definitions in SCM) in order to have Jenkins push this build time data to the Graphite server. From Graphite’s web UI we could then visualize this build time data for each of the components of our product.
Here’s an example of our build time data visualized in Graphite. As you can see it is functionally correct, but it’s difficult to get excited about using something like this:
Setting up the Graphite server with Puppet looks something like this:
  class { 'graphite':
    gr_max_creates_per_minute    => 'inf',
    gr_max_updates_per_second    => 2000,

    # This configuration reads from top to bottom, returning first match
    # of a regex pattern. "default" catches anything that did not match.
    gr_storage_schemas        => [
      {
        name                => 'build',
        pattern             => '^build.*',
        retentions          => '1h:60d,12h:5y'
      },
      {
        name                => 'carbon',
        pattern             => '^carbon\.',
        retentions          => '1m:1d,10m:20d'
      },
      {
        name                => 'collectd',
        pattern             => '^collectd.*',
        retentions          => '10s:20m,30s:1h,3m:6h,12m:1d,1h:7d,4h:60d,1d:2y'
      },
      {
        name                => 'vCenter',
        pattern             => '^vCenter.*',
        retentions          => '1m:12h,5m:1d,1h:7d,4h:2y'
      },
      {
        name                => 'default',
        pattern             => '.*',
        retentions          => '10s:20m,30s:1h'
      }
    ],
    gr_timezone                => 'America/Los_Angeles',
    gr_web_cors_allow_from_all => true,
  }
There are some noteworthy settings there:
- gr_storage_schemas – This is how you define the stat roll-ups, ie. “10 second data for the first 2 hours, 1 minute data for the next 24 hours, 10 minute data for the next 7 days”, etc. See Graphite docs for details.
- gr_max_creates_per_minute – This limits how many new “buckets” Graphite will create per minute. If you leave it at the default of “50″ and then unleash all kinds of new data/metrics onto Graphite, it may take some time for the database files for each of the new metrics to be created. See Graphite docs for details.
- gr_web_cors_allow_from_all – This is needed for the Grafana UI to talk to Graphite (see later in this post)
Collecting More Data with “collectd”
After completing the effort to log all Jenkins build time data to Graphite, our attention turned to what other sorts of things we could measure and visualize. We did a 1-day R&D Hackathon project around collecting metrics from the various production web apps that we run within the R&D org, ex: Jira, Confluence, Jenkins, Nexus, Docker Registry, etc.
Over the course of doing our Hackathon project we realized that there was a plethora of tools available to integrate with Graphite. Most interesting to us was “collectd” with itsextensive set of plugins, and Grafana, a very rich Node.js UI app for rendering Graphite data in much more impressive ways than the static “Build Time” chart that I included above.
We quickly got to work and leveraged Puppet’s collectd module to collect metrics aboutCPU, RAM, network, disk IO, disk space, and swap activity from the guest OS’s of all of our production VMs that run Puppet. We were also able to quickly implement collectd’spostgresql and nginx plugins to measure stats about the aforementioned web apps.
Using Puppet, we can deploy collectd onto all of our production VMs and configure it to send its data to our Graphite server with something like:
# Install collectd for SLES & Ubuntu hosts; Not on OpenSuSE (yet)
  case $::operatingsystem {
    'SLES', 'Ubuntu': {
      class { '::collectd':
        purge        => true,
        recurse      => true,
        purge_config => true,
        version      => installed,
      }
      class { 'collectd::plugin::df': }
      class { 'collectd::plugin::disk':
        disks          => ['/^dm/'],
        ignoreselected => true,
      }
      class { 'collectd::plugin::swap':
        reportbydevice => false,
        reportbytes    => true,
      }
      class { 'collectd::plugin::write_graphite':
        protocol     => 'tcp',
        graphitehost => 'vi-devops-graphite1.lab.vi.local',
      }
      collectd::plugin { 'cpu': }
      collectd::plugin { 'interface': }
      collectd::plugin { 'load': }
      collectd::plugin { 'memory': }
      collectd::plugin { 'nfs': }
    }
    default: {}
  }
For another example w/details on monitoring an HTTP server, see my previous post:Private Docker Registry w/Nginx Proxy for Stats Collection
Collecting vCenter Data with pyVmomi
After the completion of the Hackathon, I pointed the intern to the pyvmomi Python module and the sample scripts available at http://vmware.github.io/pyvmomi-community-samples/, and told him to get crackin’ on making a Python data collector that would connect to our vCenter instance, grab metrics about ESXi cluster CPU & memory usage, VMFS datastore usage, along with per-VM CPU and memory usage, and ship that data off to our Graphite server.
Building a Beautiful Dashboard with Grafana
With all of this collectd and vCenter data now being collected in Graphite, the only thing left was to create a beautiful dashboard for visualizing what’s going on in our R&D infrastructure. We leveraged Puppet’s grafana module to setup a Grafana instance.
Grafana is a Node.js app that talks directly to Graphite’s WWW API (bypassing Graphite’s very rudimentary static image rendering layer) and pulls in the raw series data that you’ve stored in Graphite. Grafana allows you to build dashboards suitable for viewing in your web browser or for tossing up a TV display. It has all kinds of sexy UI features like drag-to-zoom, mouse-over-for-info, and annotation of events.
There’s a great live demo of Grafana available at: http://play.grafana.org
Setting up the Grafana server with Puppet is pretty simple. The one trick is that in order to save your Dashboards you need to setup Elasticsearch:
  class { 'elasticsearch':
    package_url => 'https://download.elasticsearch.org/elasticsearch/elasticsearch/elasticsearch-1.2.2.deb',
    java_install => true,
  }

  elasticsearch::instance { 'grafana': }

  class { 'nginx':
      confd_purge => true,
      vhost_purge => true,
  }

  nginx::resource::vhost { 'localhost':
    www_root       => '/opt/grafana',
    listen_options => 'default_server',
  }

  class { 'grafana':
    install_dir         => '/opt',
    elasticsearch_host  => $::fqdn,
  }
Closing Thoughts
One of the main benefits of this solution is that we can have our data from disparate data sources in one place, and plot these series against one another. Unlike vCenter’s “Performace” graphs which are slow to setup and regularly time-out before rendering, days or weeks of rolled up data will load very quickly in Graphite/Grafana.
Acknowledgements
- Thanks to our intern Ryan Henrick for his work this past Summer in implementing these data collectors and creating the visualizations.
- Thanks to Alan Grosskurth from Package Lab for pointing me to Grafana when I told him what we were up to with our Hackathon project.
'Security > Monitoring' 카테고리의 다른 글
| [Monitoring] NetFlow 데이터 분석 관련 프로그램 설치 및 활용 (0) | 2014.11.28 |
|---|---|
| [Monitoring] Netflow 와 분석도구의 활용 (0) | 2014.11.28 |
| [Monitoring] Top 25 Best Linux Performance Monitoring and Debugging Tools (0) | 2014.11.26 |
| [Monitoring] 네트워크 트래픽 모니터링 툴 iftop (0) | 2014.11.26 |
| [Monitoring] Collectd Graph Panel v0.4 (0) | 2014.11.14 |


댓글